Using NBS-1010A Resolution Test Target
 A resolution test chart is used to allow quick and easy testing of the ability of an optical system to produce images with fine detail. The patterns are in groups which progressively get smaller. The smallest group for which the correct number of bars and spaces can be counted (in both dirrections) is the system resolution. Resolution is most commonly measured in cycles per mm (cy/mm), where a bar and a space equal on cycle. For example, a test image that has 5 cy/mm bars and spaces will have a bar 0.1mm wide and a space 0.1mm wide.
Bar type test charts are normally available on photo paper for reflection imaging with bars down to about 20 cy/mm; transparent flexible file to about 180 cy/mm; and chrome on glass to 512 cy/mm.
When evaluating a system used for visual analysis, you need only to place a test pattern of known size in the field of view, then view it (by eye, camera, etc.) to see the smallest group that is output. One of the oldest, most common charts, is the USAF-1951 test chart which has some design features specified in MIL-STD-150A. It is available from APPLIED IMAGE as the T-20 pattern.
One rather large drawback of this pattern is that the labels only indicate groups and elements, so a look up chart is needed to find out what the actual resolution is of an element.
The APPLIED IMAGE T-21 solves this problem and still maintains compliance with MIL-STD-150A because the standard only specifies the density, number of bars and progression of elements (not the labeling of arrangement).
The T-21 has labels which state the actual cy/mm of each element, so no look-up table is needed.
The T-22 further improves the pattern by arranging the elements in straight lines (much easier to locate, much easier to scan). Of course, it still meets the requirements of MIL-STD-150A. Finder squares have been added to help determine which element is being viewed, when the labels cannot be clearly seen.
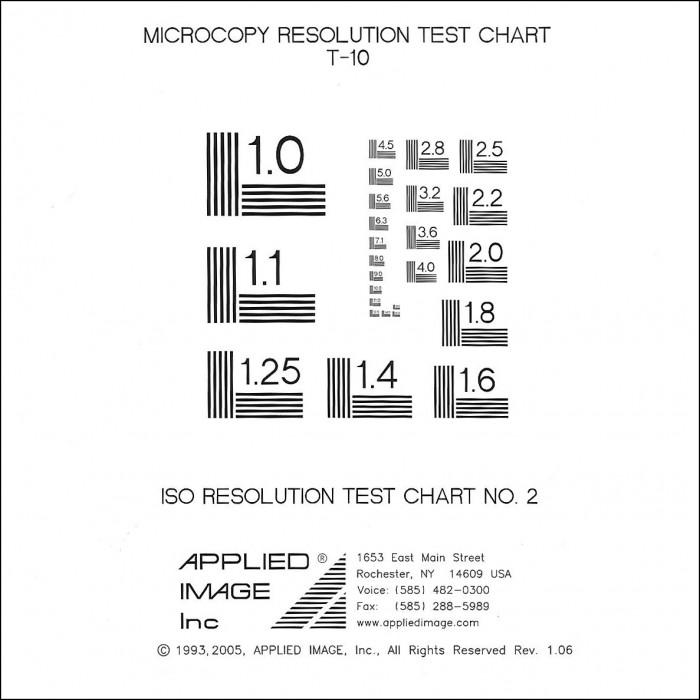
Many other types of resolution test charts exist. The NBS-1010 / ISO #2 (APPLIED IMAGE T-10) is similar to the USAF-1951 chart, but has longer bars and uses 5 bars instead of 3.